Commercial Off-The-Shelf Climate Chamber
Research and Design Project
Snapshot Overview
Project Dates: May 2022 through December 2023
Technical Skills Used:
-
Circuit Design & Analysis
-
PCB Design
-
Soldering
-
Arduino Programming
-
Sensor Integration
-
Inductive Charging
-
Control System Design
Project Outcome(s):
-
Successful development and optimization of a commercial off-the-shelf (COTS) climate chamber created to expose contents to a controlled heated and humid environment.
-
Regulated humidity between 15% and 95% relative humidity (RH).
-
Regulated temperature between room temperature and 100 degrees Fahrenheit (F),
-
Consistent data log of chamber internal temperature and humidity for verification of test results.
-
Verification of climate control system proved successful in maintaining set points for both humidity and temperature.

The development of a temperature and humidity control chamber was the first portion of a two-part research project meant to quantify the moisture leakage into glass mason jars over time. The reasoning for this overall research project was to understand the consequences of dry-room failure in the storage of materials with irreversible reactions to moisture. This portion of the project required the research team to create a consumer off-the-shelf (COTS) temperature and humidity chamber to act as a testing environment for the mason jar research. The chamber needed to maintain reasonably consistent levels of both relative humidity and temperature over testing periods ranging from a week to over a month. The successful implementation of the climate chamber would allow the team to expose the test jars to consistent, controlled environment.
The climate chamber was built within a pre-existing wooden crate for ease of storage. The chamber itself was lined with Styrofoam insulation, with the walls sealed with silicon caulking. The team developed a lid for the chamber using Styrofoam insulation and nine small relief holes. The floor of the chamber was lined with eight inductive coil transmitters which were covered and protected by a quarter inch thick piece of clear acrylic. Inductive coil pairs were implemented in response to battery capacity constraints. I have written an in-depth explanation on the inductive coil pairs and their function on my Glass Jar Sensor Package page.
Chamber Design
Control of the climate chamber was performed by an Arduino Nano Every, as this was the same microcontroller chosen to use for the sensor package systems. A flowchart demonstrating the general progression of the humidity control is shown to the right. The most important portion of the control code takes up only about one third of the flowchart (located on the lowest third of the diagram). The remainder of the control code is only run when the system is powered on.
Humidity control in the chamber functioned in a simple feedback loop. A normally open relay was connected to the humidifier's power cable and controlled whether the humidifier was powered on or not. An SHT40 temperature and humidity sensor was located within the chamber at a distance from the humidity inlet. The sensor took temperature and humidity readings every 6 milliseconds and used the sensor's input to determine whether to power on the humidifier. This determination was set using a humidity threshold.
If theSHT40 read a humidity level lower than the set threshold, a signal was sent to the relay to close the circuit and power the humidifiers on. For a majority of the month long tests, we were asked to set the humidity level to 90% relative humidity (the threshold shown in the diagram to the right).
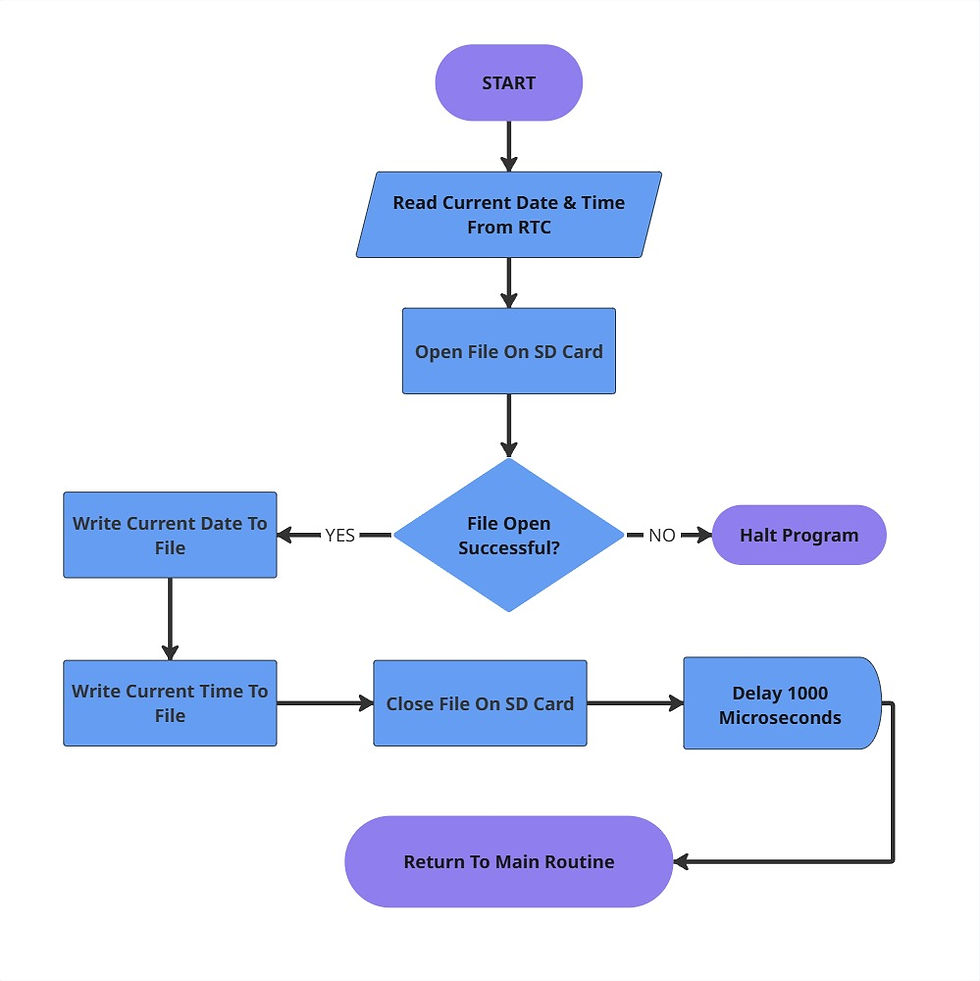
Each measurement was written to a MicroSD card, attached to the Arduino board, along with the corresponding date and time of the measurement. The time and day of each measurement was determined using a real-time clock (RTC) module attached to the Arduino. The RTC module had its own coin-cell battery which allowed it to keep a consistent gage on the time and day, even as the system is powered down.
The two diagrams below demonstrate the subroutines used in logging the sensor measurements and logging the day and time of each measurement.
Climate Control
.jpg)
Temp. & Humidity Subroutine
.jpg)
Date & Time Subroutine
.jpg)
_HEIC.png)